
Today, customer service is no longer simply a supporting role for business operations; it has become an indispensable activity for every business, helping to generate higher revenue and differentiate itself from competitors.
50% Customers are willing to spend more if they feel satisfied with customer service.
Customer service also impacts all business activities, from products, marketing, sales processes, and many other activities, while also playing an important role in shaping corporate culture.
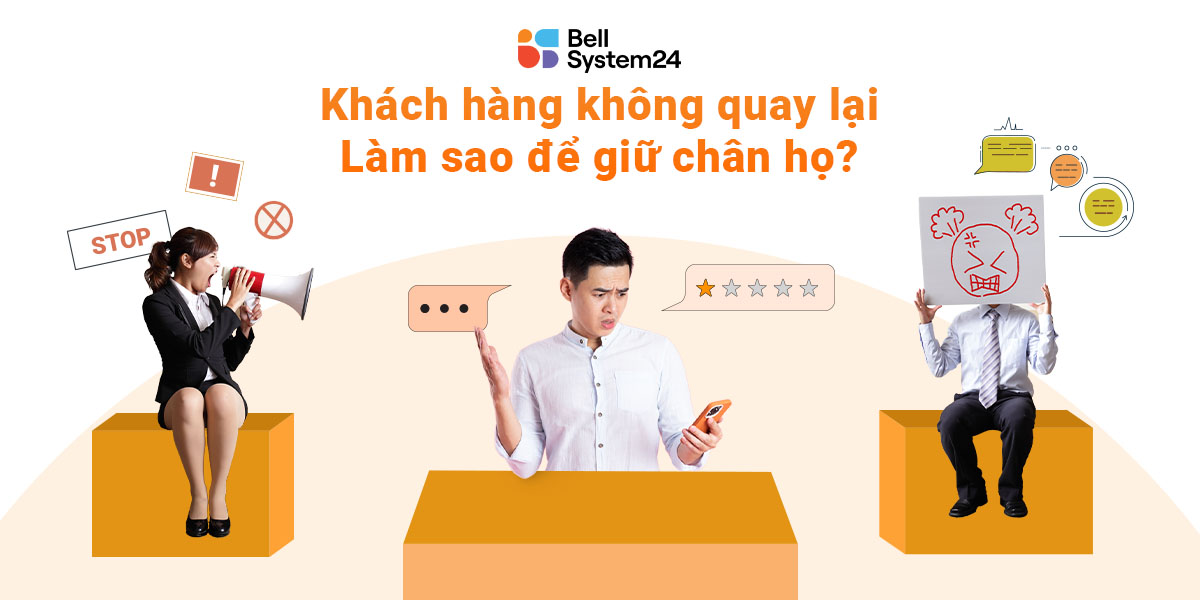
How satisfied are your customers?
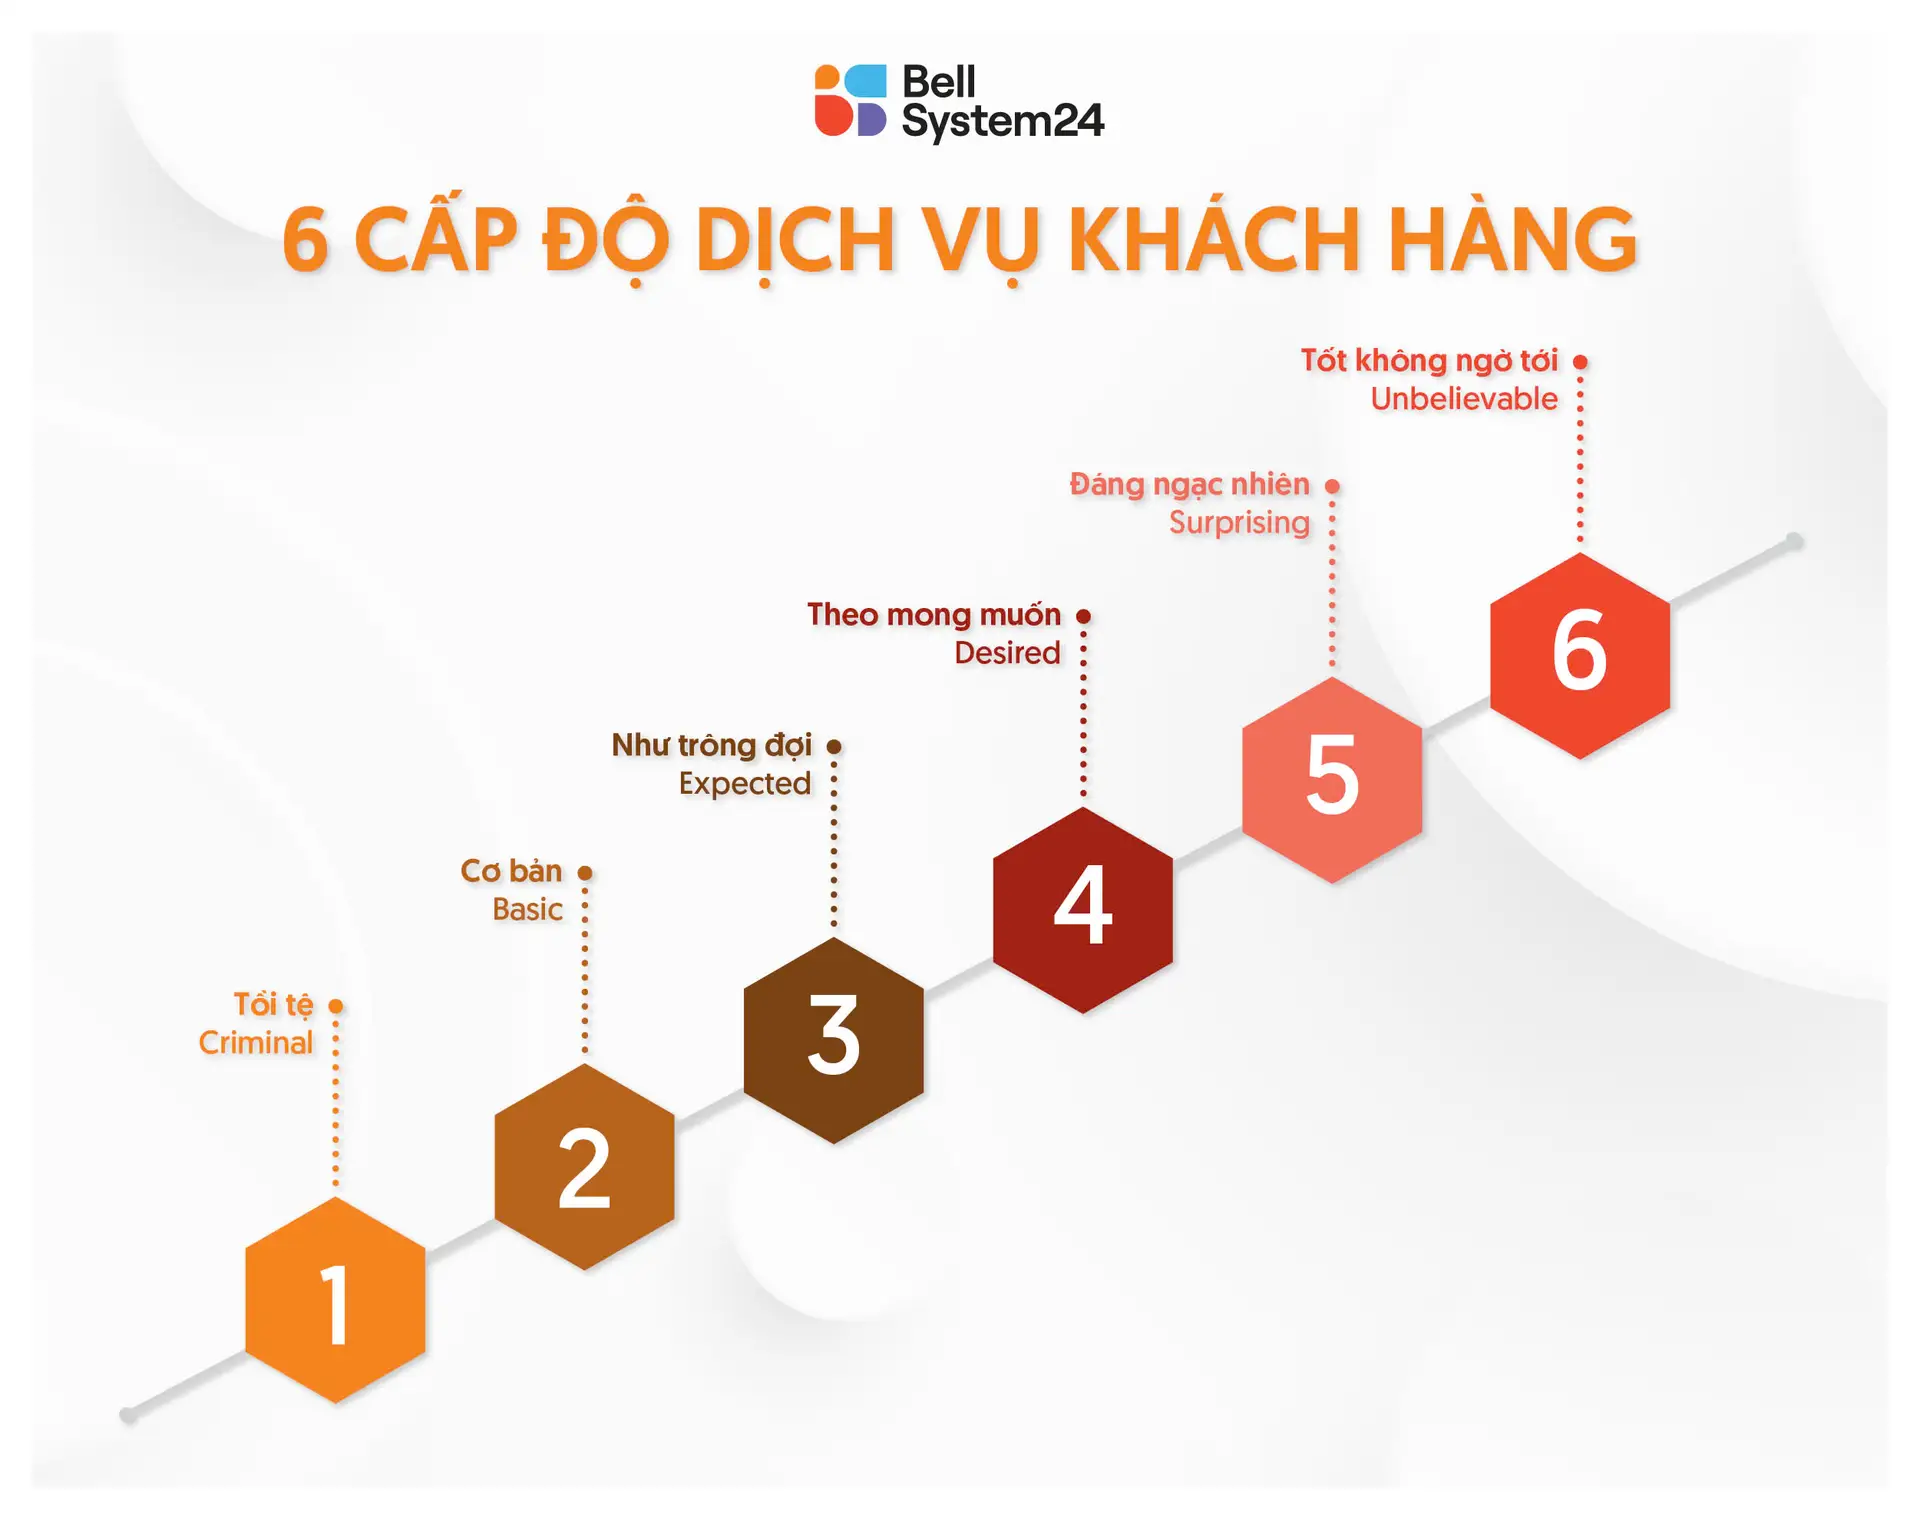
Level 1: Terrible
This is the lowest level, where the service fails to meet even the most basic expectations of customers. Previous commitments are broken, leading to disappointment and frustration. At this stage, customers may file direct complaints, post negative comments on social media or review platforms, negatively impacting the brand.
Level 2: Meets basic standards
The service only meets basic needs without creating any added value. Customers may not complain directly, but they are dissatisfied and will often not return. This is the level at which a business merely exists without creating any differentiation.
Level 3: Meets expectations
At this level, the service is provided exactly as customers expect—nothing less, but nothing more special either. This means that customers may return if they cannot find a better option, but they will not feel any loyalty or strong impression toward the brand.
Level 4: Satisfy customer desires
The service is designed to precisely meet the needs and desires of customers, delivering satisfaction and a sense of comfort. When this level is achieved, the business can ensure a certain level of customer loyalty, as they find what they expect without having to look elsewhere. This is considered the minimum standard for any business seeking success in the service industry.
Level 5: Create positive surprises
Customers are not only satisfied but also receive more than they expected—like a surprise gift. Such a positive experience will make customers remember the brand, return more often, and be willing to recommend it to friends and family.
At this level, businesses often use strategies to personalize the customer experience.
Level 6: Outstanding beyond expectations
This is the pinnacle of customer service – when the experience is so good that customers can't believe it. They feel thoroughly cared for, valued, and deeply impressed by the brand. When this level is achieved, customers are not only loyal but also actively spread the word about their wonderful experiences.
Any customer service effort will be judged as successful or not, all depending on how satisfied customers are with the experience they receive. How do you measure and analyze these metrics?

1. CSAT – Customer Satisfaction
CSAT is a measure of customer satisfaction. This index is typically measured through surveys after each support interaction, helping to assess customer satisfaction with customer service representatives.
Survey customers with the question: Are you satisfied with the quality of service?

⇒ If the CSAT score is low, the quality of service and work processes should be reviewed.
See also: Customer satisfaction survey template.
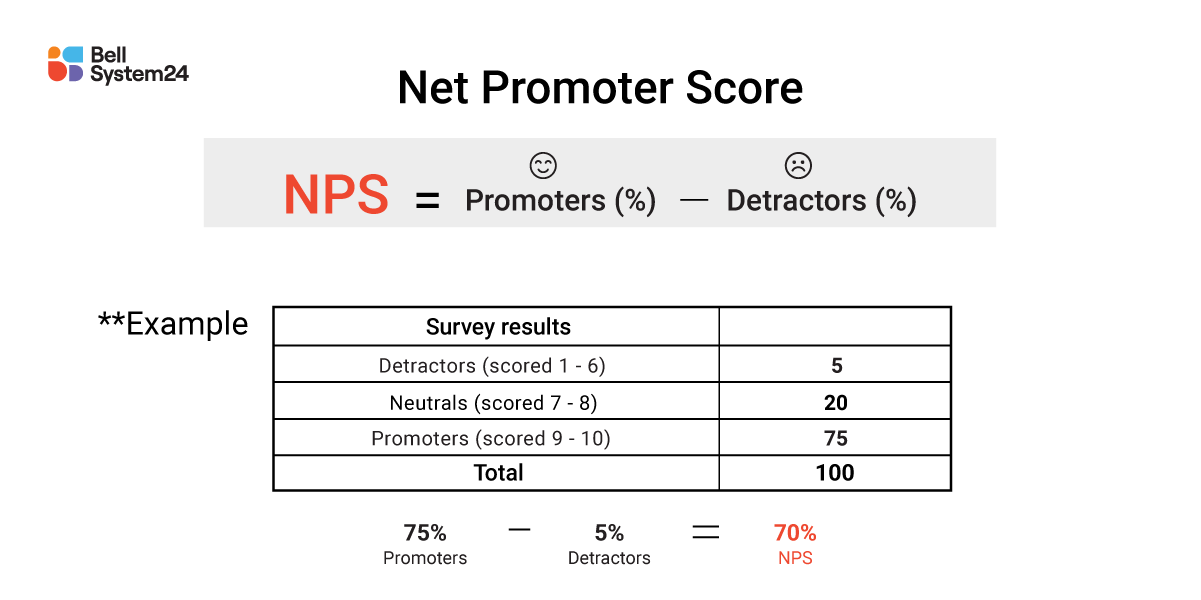
2. NPS – Net Promoter Score
NPS is an index that measures whether customers are willing to recommend a business to others.
A low NPS may indicate that customer service representatives have not created a memorable experience or have not resolved issues thoroughly.
NPS Formula = % Promoters – % Detractors
3. Customer Effort Score – CES
CES is an index that measures the level of effort customers must exert to perform a specific action. In customer service, this could be the effort customers make to receive support; this index describes the difficulty customers encounter during their service experience.
CES is measured through the question "Was your experience easy?" Using a scale from 1 = “very difficult” to 7 = “very easy”.

4. Average number of tickets.
*Ticket: Tickets created based on customer support requests are stored in the system.
Average Tickets helps you measure the number of customer issues that require support. You can measure it on a daily, weekly, monthly, quarterly, or yearly basis.
When a business receives more tickets, it means that the customer service department is working hard, and it also indicates that customers are having problems with the business frequently, and that the product/service may not be good. When there are fewer tickets, it may mean that your customer base is low, or that your product/service is great.
How to improve Ticket quantity.
- Communicate to your Marketing department about common customer problems that require assistance, and your Marketing department is responsible for packaging and communicating solutions to common problems to customers, empowering customers to solve their own problems.
- Make sure your customer service department is always staffed enough to handle all customer issues.
5. Number of pending tickets.
Backlog is the number of customer tickets waiting to be processed. You can measure this metric at any time.
This index is subjective to the business. Failure to process all tickets is due to unsatisfactory performance. It alerts to staff capacity, shortage of staff, suboptimal customer support technology, and inadequate customer service processes.
While the speed at which a customer request is processed isn't the most important aspect of customer service, it does impact the quality of the experience.
Improved Ticket inventory.
- Understand and improve your customer service process from end to end.
- Ensure competent staff.
- Ensure adequate staffing.
- Technology to support optimal customer care.
6. Customer response time.
How long does it take for customers to receive a response from an operator when they contact the operator?
The industry standard for call centers is 80/20, meaning that 80% of calls will be answered within the first 20 seconds. Today, customers want faster responses across all contact channels, and businesses that can meet this demand will improve the customer experience.
You can refer to: Customer response time standards across service channels.
This metric tells you how quickly your Customer service team is responding to customers.
- If the response rate is lower – Operational performance is guaranteed, customer care call center technology is optimized, customer experience is good.
- If this index is higher – Low performance, poor technology, bad customer experience.
How to improve first response time.
- Ensure employee capacity and performance.
- Build quality switchboard system.
- Combining IVR and ACD routes calls appropriately, increasing problem resolution time.
7. Percentage of issues resolved completely during the first support interaction.
FCR (First Contact Resolution) is an important metric that indicates the percentage of customer issues that are resolved 100% within the first customer service call.
This metric highlights the ability and effectiveness of employees in solving problems. An average FCR increase of 11% will lead to an 11% increase in customer satisfaction, demonstrating how crucial FCR is in enhancing customer satisfaction.
But measuring FCR is relatively complicated, you can refer to the in-depth article here: FCR measurement and analysis.
FCR tells you how effective your Customer service department is and proves that your construction company's customer support policies are correct if the FCR is high.
How to improve FCR.
- Train employees in analytical skills, problem solving and good communication.
- Build a specific, easy-to-follow problem-solving process with detailed instructions that can be spoken or sent via customer email.
- Build a CRM system to store business information.
8. Average problem resolution time.
How long does it take for customer service to resolve customer requests?
Today's customers not only want accurate support, but also fast.
This metric measures performance, showing how quickly your staff supports customers, improve to make processing times faster.
You can refer to: Methods to reduce call handling time.
9. Number of interactions per ticket.
This metric shows how many interactions it takes your staff to completely resolve a customer issue. The lowest score is 1 (called FCR as above), the higher the score the worse, it indicates that the effectiveness of each message your staff conveys is ineffective, or your incident support policy is not optimal.
10. Favorite channel.
This is the channel where customers will interact with the business the most. This is not necessarily a statistic, here Bellsystem24-Vietnam cannot say which channel is more effective than the other because each business will have a different level of effective interaction on each channel.
This index shows: Which channels do customers tend to communicate with businesses on. Helps businesses allocate resources and focus on exploiting targeted channels.
See also: Most preferred customer service channels.