The standard measurements that a Call center can be referenced and used as a measure of the quality of your service. You can apply and come up with ideas for improvement.
1. Average processing time
Average processing time (AHT – Average Handling Time): is the average amount of time it takes an agent to complete an interaction with a customer.
Calculation formula: AHT = Waiting time + Talking time + Data processing time.
The standard AHT index for Call centers is 6 minutes, however, this index can change more or less depending on the characteristics of your business (Field, product, scale). A statistic from Cornell University shows that the average call handling time of Call centers is different, the results are shown in some industries in the table below:
| Business Field | Average processing time |
| Telecommunications | 528 |
| Retail | 324 |
| IT Services | 282 |
| Financial Services | 282 |

How to improve call center AHT index
Regardless of whether AHT is high or low, the most important factor is still quality. Most Call Center managers want to reduce AHT to a lower level, to answer customer questions faster, and improve the quality of customer experience.
To optimize AHT without reducing service quality, Call Centers can apply the following strategies:
- Operator training: Equip yourself with effective communication, analysis and problem-solving skills. According to research from ICMI, Call Centers that invest in employee training reduce 15% AHT within 6 months.
- Technology application: Use CRM software and automation tools like RPA (Robotic Process Automation) to help employees quickly look up information and process data. For example, a large Call Center in the US reduced 20% AHT after integrating AI chatbot into the customer support process.
- Enhanced self-service: Build self-service support channels like FAQs or smart support apps, which reduce the number of complex requests agents need to handle.
- Data analysis: Use data analytics to identify process bottlenecks and optimize each step of the customer journey. A report from Deloitte found that detailed call analysis reduced average handling times by up to 12%.
While AHT is an important call center metric, businesses need to adjust this target flexibly to suit the specifics of the industry and customer expectations. A short AHT is not always good if the service quality is not guaranteed, and conversely, a longer AHT is acceptable if customers receive comprehensive and effective support.
Bellsystem24 Vietnam There is an article with detailed instructions on how to improve this index, you can find it here: How to reduce call handling time.
2. Problem resolution rate on first contact
First Contact Resolution Rate (FCR – First Contact Resolution)
FCR is an important Call Center metric that measures the ability to handle and resolve customer requests or issues thoroughly on the first contact without the need for follow-up or re-contact. This metric directly reflects the Call Center's operational efficiency and customer satisfaction.
According to a report from SQM Group, the global average FCR ranges from 70-75%, but top Call Centers can achieve rates of up to 85% or higher. A high FCR means that customers receive fast, accurate service and do not have to spend additional time resolving issues over multiple interactions. Research also shows that every 1% improvement in FCR can increase customer satisfaction by 1%, while failure to resolve issues on the first contact accounts for 34% of customer dissatisfaction.
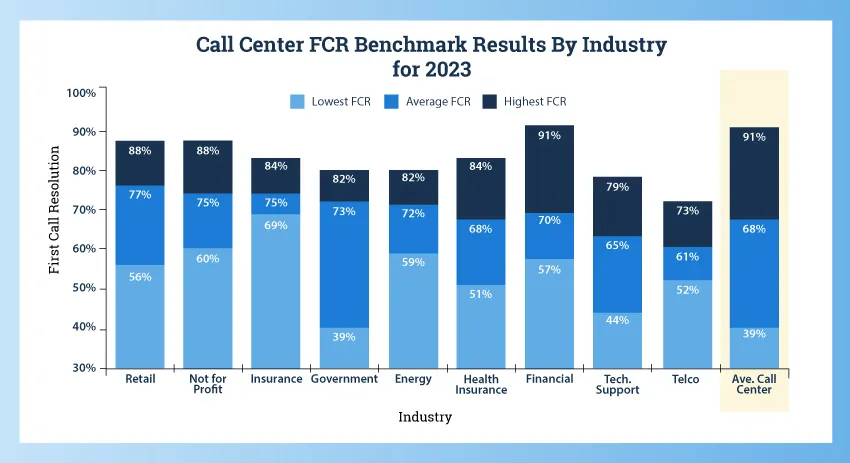
However, FCR rates can vary depending on the customer engagement methods you use. As different channels appear, FCR will change, making this metric even more difficult to determine when you use multi-channel call center systems (Multi-Channel Contact center), but it would be easier if it was an integrated multi-channel switchboard (Omni-Channel Contact center).
How to improve FCR
To optimize this important Call Center metric, businesses can apply the following strategies:
- In-depth training of customer service staff: Customer service staff need to be fully equipped with communication, analytical and problem-solving skills. According to SQM Group, well-trained staff can help increase FCR by 5-7%.
- Improved database and support tools: Using modern data management tools like CRM or RPA makes it easy for employees to access customer information, thereby solving problems quickly and accurately. A study by Forrester shows that good support systems reduce average handling time and increase FCR by up to 15%.
- Root cause analysis of unresolved issues: Detailed analysis of FCR failures can help businesses identify process bottlenecks and improve them. For example, a US Call Center increased its FCR from 72% to 80% after improving its complaint handling process based on data analysis.
- Artificial Intelligence (AI) Applications: Chatbots or AI tools not only assist employees in providing information but also help reduce repetitive requests, focusing human resources on more complex issues. According to McKinsey, the use of AI can increase FCR by 10-12%.
See more: How to calculate FCR and optimize
3. Service Level
Service Level (SL – Service level): Is one of the most important indicators in the set of criteria for evaluating the quality of Call center operations.
The standard call center Service level index is 80/20, which means 80% customer calls will be answered within 20 seconds. However, the issue of improving the quality of customer experience is increasingly required, so some Call centers raise the Service level to 90/10. At Bellsystem24 Vietnam, in 2019, there was a customer care project that reached the service level threshold of up to 99.1%, an extremely difficult index to achieve. You can refer to this case study in the article: Customer care case study achieving Service level 99.1%.
It should also be noted that achieving service level 100% will never happen Because of the impact of issues related to the Call center system, external factors and you have to own a very large team of call center operators.
Service level of each channel
Above, Bellsystem24 Vietnam has given SL index for voice channel (the most popular Call center channel), but if you use the system multi-channel switchboard (Contact center), these metrics need to be measured more and will vary. Here are the standard communication channels and service level metrics:
- E-mail: 95% Email must be responded to within 4 hours (You can go further with 80% responded to within 15 minutes).
- Live Chat: 80% Live chat conversations answered within 40 seconds.
- Letter (Paper letter): 95% was answered within 3 days.
- SMS: 80% messages are answered within 40 seconds.
- Social network: 80% contact answered within 20 minutes.
See also: How to calculate the number of employees in a call center.
How to improve SL index in Call Center:
- Use smart forecasting and scheduling software: Tools like Workforce Management (WFM) help accurately forecast call volumes and schedule staff accordingly. According to NICE research, using WFM can improve service levels by up to 15%.
- Increased automation: Use IVR (Interactive Voice Response) or chatbots to handle basic requests, reducing the pressure on agents. A study from Gartner shows that integrating IVR can improve average SL by 10%.
- Optimize employee training process: Well-trained agents handle calls faster and more efficiently, which improves SL. A report from SQM Group shows that well-trained agents can help improve service levels by up to 20%.
- Data tracking and analysis: Use performance analytics tools to monitor SL in real-time and make timely adjustments when needed.
See also: How to measure and improve Service level in detail.
4. Customer Loyalty Points
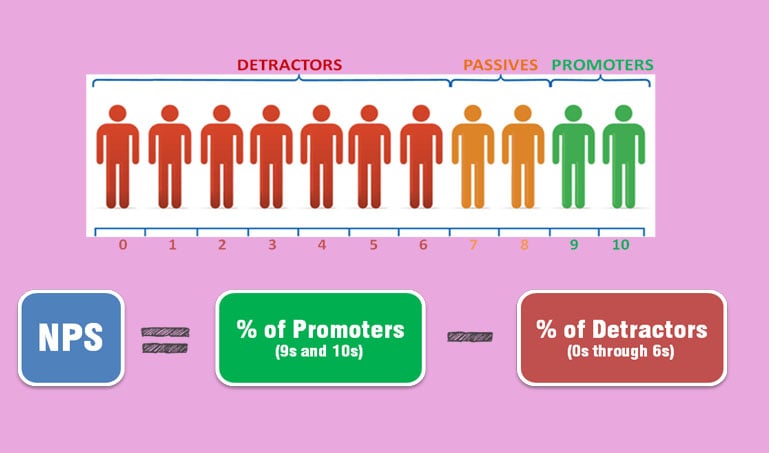
Customer Loyalty Score, or NPS, is one of the most popular call center metrics for measuring customer satisfaction and loyalty to a business's services or products. Customer Loyalty Score (NPS – Net Promoter Score) The standard is 8 (min-0, max-10). NPS also varies greatly from industry to industry. But in general, the higher the better.
How to Measure NPS
NPS is determined through a single question, such as: “Would you be willing to recommend our services/products to others?”.
- Promoters: Those who rate 9-10 are typically loyal customers who are more likely to recommend and promote the business.
- Passives: Those who rated 7-8 were satisfied but not proactive in recommending.
- Detractors: Those who rate from 0-6, can be dissatisfied and even negatively impact the business reputation.
NPS calculation formula: NPS = % Promoters – % Detractors
We have a detailed article on: Methods for determining, calculating NPS and improving. It is very important, please refer to it.
How to Improve NPS
Focus on the detractor group
The information you get from your detractors is sometimes more important than your promoters, because you can look at objectively assessed weaknesses and make recommendations for improvement.
Route calls appropriately
Use IVR and ACD to distribute customer calls to the right agents. For example, agents who have high expertise in a particular issue, or agents who have answered the same customer many times and received satisfaction. This way you can improve customer loyalty significantly.
5. Maximum working efficiency
Maximum performance (MO – Maximum Occupancy) is a call center index that measures the actual working ability of the Agent based on the maximum productivity (100%) that they can do.
The average MO in the call center industry is 83.3%.
Agents never reach full performance of 100%, because during the working process, there are personal or external factors that affect the work, causing the Agent to not fully focus 100% on the work for a long period of time (For example, the Agent randomly receives a text message from the phone and distracts them from their work). Most Call center managers expect the MO index to be around 90%, but in reality it is often lower!
According to ContactBabel's report, the average MO index in the Call Center industry fluctuates at 83.3%. This MO level is considered ideal, allowing agents to maintain stable work performance without too much pressure. However, this number can vary depending on the specific industry. For example:
- In the fast-service industry, MO is typically achieved from 85-90% due to the need to process large volumes of simple requests.
- In finance or high tech, MO is usually lower, at 75-80%, as calls are often more complex and take longer to handle.
How to improve MO
- Allocate resources appropriately: Forecast and manage workload to ensure that each agent has enough time to complete tasks without being overwhelmed. According to a report from Deloitte, call centers using intelligent forecasting tools reduced customer wait times by 20%, while maintaining optimal MO.
- Increased automation: Applying automation technologies such as chatbots and IVR (Interactive Voice Response) to reduce the workload of agents, allowing them to focus on more complex issues. A typical example is Amazon, where integrating AI chatbots has reduced Agents' workload by 25%, thereby maintaining a reasonable MO.
- Staff training: Equip employees with the skills to handle problems faster and more effectively, reducing the time it takes to handle each call without compromising service quality. A study by SQM Group shows that employee training improves MO by up to 10% while still ensuring customer satisfaction.
- Continuous monitoring and adjustment: Use performance analysis tools to monitor MO and make timely adjustments if you find that this metric is above or below the standard.
So, Call Center Metrics, such as AHT, FCR, SL, NPS, and MO, are important measures of call center efficiency and service quality. Optimizing these metrics not only enhances customer experience but also improves operational efficiency. Strategies such as employee training, technology application, data analysis, and increased automation have proven effective in improving Call Center Metrics, helping businesses achieve their goals of flexibility and sustainability.


